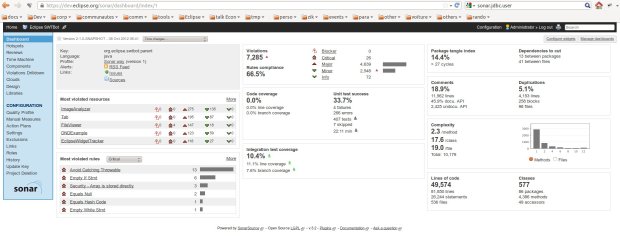
It’s been awhile since I started bugging around with having Sonar at Eclipse.org. But there has been a lot of progress recently, enough progress to share them in a blog post and get you start using Sonar. So let’s get started evangelizing the fight against technical debt.
What’s the current status for most Eclipse projects?
Most Eclipse projects now have an automated build system, and have this integrated in Hudson. All projects do have some acceptance tests run on each build, which help project teams to decide whether project is good to get released in its current state or not. So we can say that Eclipse projects are already leveraging Continuous Integration.
Static Code Quality Analysis
I already mentioned in in an earlier blog post (see #3 in “my favourite talks”): Static Code Analysis helps you to find mistakes you’ve done, and saves you a lot of time/money/stress/[anything you don’t want to have]. We are all humans, and humans make mistakes. In software development, we are lucky to have some great tools to tell us quickly and for free when we are doing something wrong. In my previous post, I shared some tricks to get Code Quality Analysis part of your workbench and give you reports as-you-type, but it can also be useful to have also some coarser-grained view of quality accross the project, and not only accross one class.
Tools such as Sonar allows you to see how the quality of your code evolves. It’s a necessary tool to go from Continuous Integration to Continuous Improvement.
Why fighting the technical debt?
Technical debt is all about pieces of your code that are not very beautiful, but which are working correctly. So you are likely to never improve them. You’ll ask me “why improving them if this works?”. There are lots of answers, but I’ll only give the one that looks the most important for Eclipse.org usage: We are open-source projects, and as committers on those projects, we must think about gettting more and more contributors. Code which has a huge technical debt is way more difficult to tweak for a newcomer to this project than “clean code”. Fighting technical debt makes your project more welcoming and more agile (as in agile “able to move/change quickly without pain”).
Important note about code quality before we start speaking of Sonar
Once again, I’ll refer to what I learnt there: http://www.eclipsecon.org/2012/sessions/how-profit-static-analysis.
If you want to start improving quality, don’t think on using Sonar first. You first step should probably be to add quality tools in your workbench: enable all JDT warnings, install FindBugs, PMD, and other quality tools. At the beginning, you may find them too verbose, but just do what they want you to do in most cases, and you’ll see you’ll probably write less bugs.
First take care of the code you write daily by leveraging such tools, they prevent from increasing the technical debt. You can’t hope to reduce existing technical debt on one side if you keep on adding some on the other side.
Why Sonar?

Sonar is basically a “quality dashboard”: it shows a lot of metrics and warnings. It relies on several common Java tools (Checkstyle, Findbugs, PMD, Jacoco…) to provide the reports and show their results in an aggregated view. That helps you to spot which pieces of your code deserve to be improved. It’s easy to use and is a very informative tool which is intended to projects teams to reduce their technical debt.
Let’s be honest: I’ve only known Sonar as an OSS quality dashboard. I don’t even know if some other exist, but I only hear about this one, and I think it good. Also the team is helpful and reactive, and they are close to the Eclipse community, as you can see by the kind of extension they develop, or their presence at EclipseCon.
Strategies to fight technical debt using Sonar reports?
Quality reports is not something you produce for each build: it takes some time to process and reduce “acceptance” feedback loop. Also, this kind of quality metrics evolve slowly, and you’ll quickly notice that re-computing them in each commit is kind of useless. Instead I’d recommend using them weekly. or on a schedule that will help you to capture trends of quality. Of course, when you think it’s useful, you can stuff run a “Sonar” job manually to see how metrics evolved after an intense clean.
Some teams have some “quality hours”: for example, on the Friday afternoon, when people don’t want to get into huge difficult tasks before week-end, developers simply have a look at Sonar and decide of reducing amount of Findbugs warnings, or to reduce duplication… Since you have a tool to tell you what should be improved, those tasks become easy, and we all need some easy tasks from time to time.
So I recommend producing reports weekly, and use Sonar to have some technical debt shooting sessions, weekly, or one week after a release build, or on any schedule you like. The important is to turn it into a regular habit.
Setting up a [Project]-Sonar build on hudson.eclipse.org
Currently, there is one pre-requisite for Hudson-Sonar integration, which is not that big since it’s already the choice made by many projects, and by CBI: your project needs to build with Maven (and Tycho if you’re building Eclipse plugins).
If you already have a Tycho-based build, it pretty easy:
- Ask for a CI job [Project]-Sonar on Hudson Sandbox
- Configure your project to run a normal build with automated tests. Do not include any publishing related stuff (profile, build steps…) into it, since it’s not the goal of this job. You may want to set the following Maven properties: -Dmaven.test.error.ignore=true -Dmaven.test.failure.ignore=true to get reports even when some tests fail.
- Go to Post-Build Actions and tick Sonar
- Ensure the Maven Version is the same as the one that perform the build
- Configured Sonar plugin: If you build using on the Private Repository Maven option (recommended), you’ll need to set Additional Properties for Sonar to -Dmaven.repo.local=$WORKSPACE/.maven/repo. It’s also recommended to set -XX:MaxPermSize=128m
You can see an example of configuration here: https://hudson.eclipse.org/sandbox/job/SWTBot-Sonar/configure
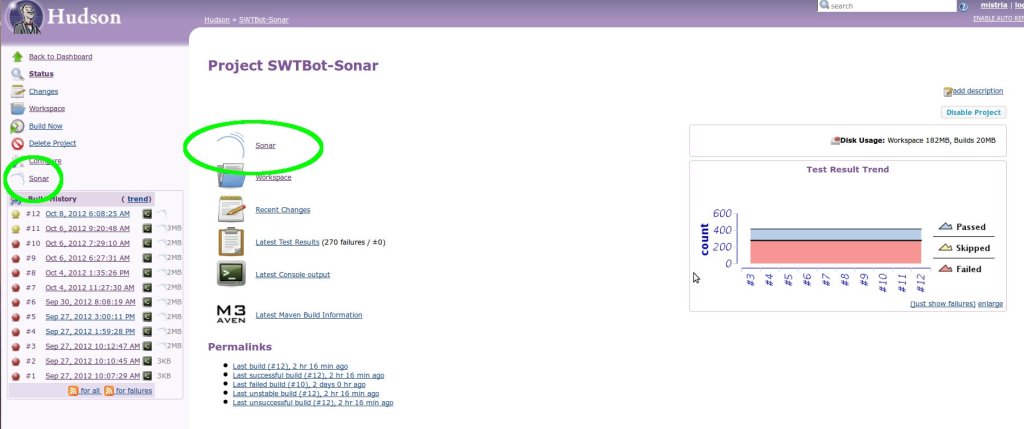
When you’re done, just run a build. If it’s blue or yellow, you’ll notice a “Sonar” link on the left of job’s page. Click it. You’re there! You can browse Sonar reports for your job, and find out some interesting stuff about your project that deserve immediate improvement. Just enjoy it, have a look at Sonar reports, find out some Findbugs warning you don’t like, install Findbugs plugin in your workbench, and spend one hour cleaning some of them. Re-build, and see how Sonar reflected your change. You reduced technical debt!
Bonus: Maven, Jacoco, and Sonar
Once again, no big difficulty here. There are only 2 constraints/rules to follow:
- Sonar only allows a single execution file (jacoco.exec) for you whole project
- The sonar.jacoco.reportPath so it references this jacoco.exec file from any “Java” (plugins or tests) module.
For example in case of “flat” project: 1 directory containing at its root the parent pom, and all modules (org.eclipse.project.*), you’d like to configure that in parent pom
<properties>
	<!-- Properties to enable jacoco code coverage analysis -->
	<sonar.core.codeCoveragePlugin>jacoco</sonar.core.codeCoveragePlugin>
	<sonar.dynamicAnalysis>reuseReports</sonar.dynamicAnalysis>
	<sonar.jacoco.reportPath>../target/jacoco.exec</sonar.jacoco.reportPath>
</properties>

<build>
	<plugins>
		<plugin>
			<groupId>org.jacoco</groupId>
			<artifactId>jacoco-maven-plugin</artifactId>
			<version>0.5.8.201207111220</version>
			<executions>
				<execution>
					<goals>
						<goal>prepare-agent</goal>
					</goals>
					<configuration>
						<!-- Where to put jacoco coverage report -->
						<destFile>${sonar.jacoco.reportPath}</destFile>
						<includes>
							<include>org.eclipse.swtbot.*</include>
						</includes>
						<append>true</append>
					</configuration>
				</execution>
			</executions>
		</plugin>
	</plugins>
</build>
For 2-folders-deep projects, where there is a parent pom.xml at root + a plugins/ folder containing plugins, and a tests/ folder containing tests, you’d rather set the sonar.jacoco.reportPath property to ../../target/jacoco.exec (so all tests and plugins look at the same jacoco.exec which is on there <firstCommonParentDirectory>/target).
Note that there is no need to put it in a profile. Indeed jacoco almost doesn’t affect performance, so it won’t slow down your build, then you’d better make it always enabled.


#1 by Sunil B on October 8, 2012 - 7:02 pm
Reblogged this on BSunil's Weblog.
#2 by Wim Jongman on October 8, 2012 - 7:08 pm
Cool stuff Mickael. I can’t wait for the Nebula sonar results. Thanks for so relentlessly chasing this.
#3 by Mickael Istria on October 8, 2012 - 7:16 pm
I’ll do the same for Nebula within the end of the week.
#4 by Lars Vogel on October 8, 2012 - 10:07 pm
You are doing awesome stuff! Thanks a lot.
#5 by Sacha labourey on October 8, 2012 - 11:47 pm
Hello Michael,
Cool stuff. If you prefer using Jenkins, you can also use CloudBees DEV@cloud and its Sonar integration. There is a free program for Open Source: http://www.cloudbees.com/foss
DEV@cloud is also where the official “Nemo” instance for Open Source projects is running from: http://nemo.sonarsource.org/
Cheers,
Sacha
#6 by Mickael Istria on October 9, 2012 - 8:30 am
When starting to interest in Sonar, we’ve used Dev@Cloud (with Xavier Seignard) to set up a similar configuration. We already demonstrated it using Eclipse Code Recommanders project, during EclipseCon North-America 2012 and Jenkins Use Conference Paris.
#7 by Sunil B on October 9, 2012 - 10:31 am
Reblogged this on BSunil's Weblog.
#8 by DominiqueD. on October 9, 2012 - 3:03 pm
There is also SQALE (Software Quality Assessment based on Lifecycle Expectations)
http://www.sqale.org/
SONAR and SQALE are quite similar, minus some (very few) SONAR features that are not in SQALE, and some (very few) SQALE features that are not in SONAR.
AFAIR, SQALE is particularly devoted to the management of the Technical Debt (or Design Debt) of software dev. It allows, for example, to estimate this debt through a price ($$$), and to offer different prioritisation strategies allowing establishing optimised payback plan.
#9 by Mickael Istria on October 9, 2012 - 3:27 pm
Thanks for the note. Is there any SQALE software? Found out only some documentations. Also SonarSource sells a SQALE plugin for Sonar: http://www.sonarsource.com/products/plugins/governance/sqale/
#10 by DominiqueD. on October 9, 2012 - 5:03 pm
ooops, good point. I made mistake, sorry.
It’s not SQALE, but Squale : http://www.squale.org/index.html
PS: I don’t know the relationships (if existing ?) between SQALE and Squale. But the fact that the names are close, and their relative subject is both about software dev, is intriguing…